Researchers at Washington University in St. Louis find an easier way to quantify synaptic loci
The brain’s vast synaptic network with billions of neurons making trillions of connections in a very dense matrix continues to challenge scientists who wish to decipher its intricacies in the context of brain health and disease. Established approaches using electron microscopy to visualize and study this elaborate landscape can be hugely time consuming and/or technically difficult to implement.
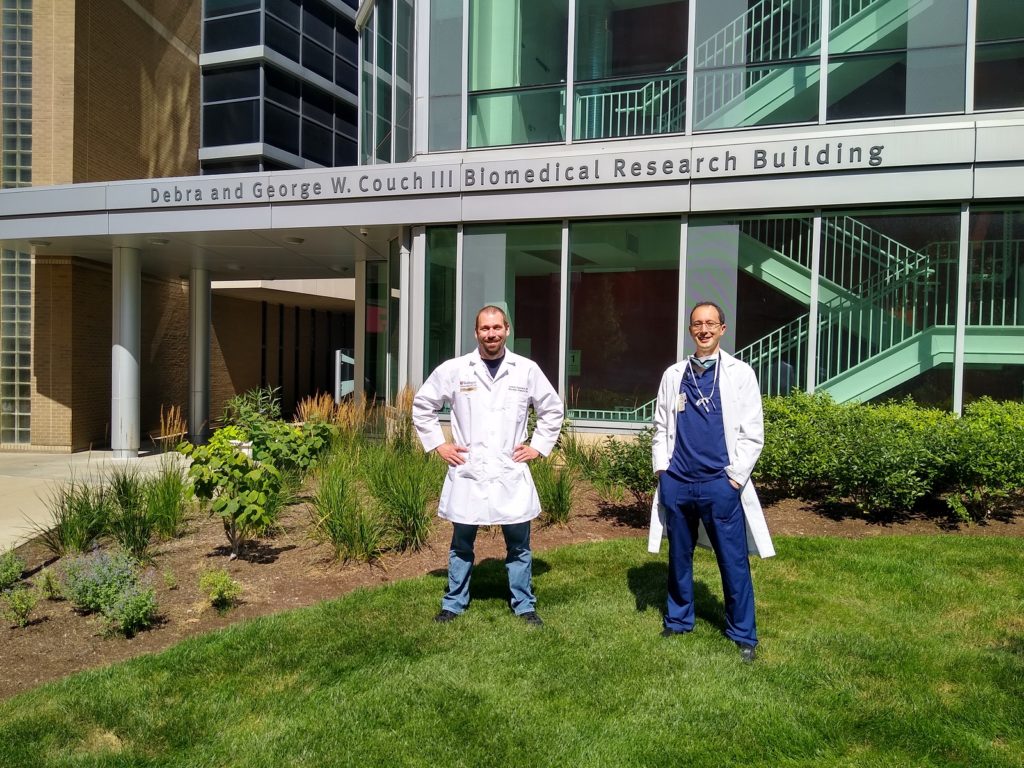
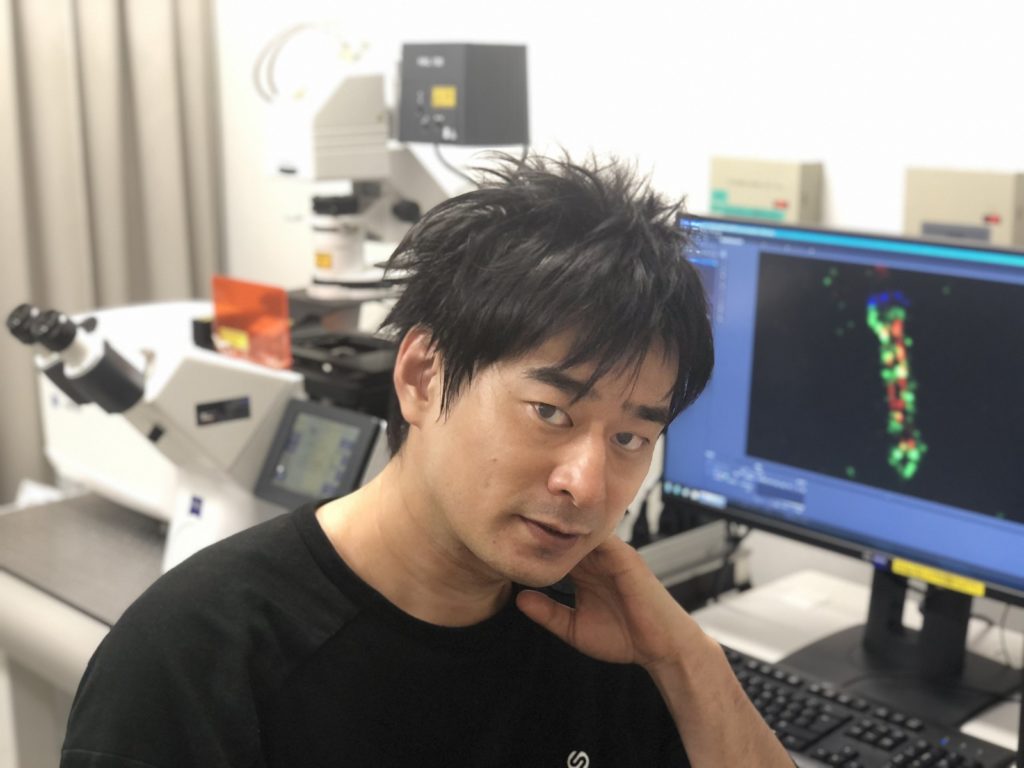
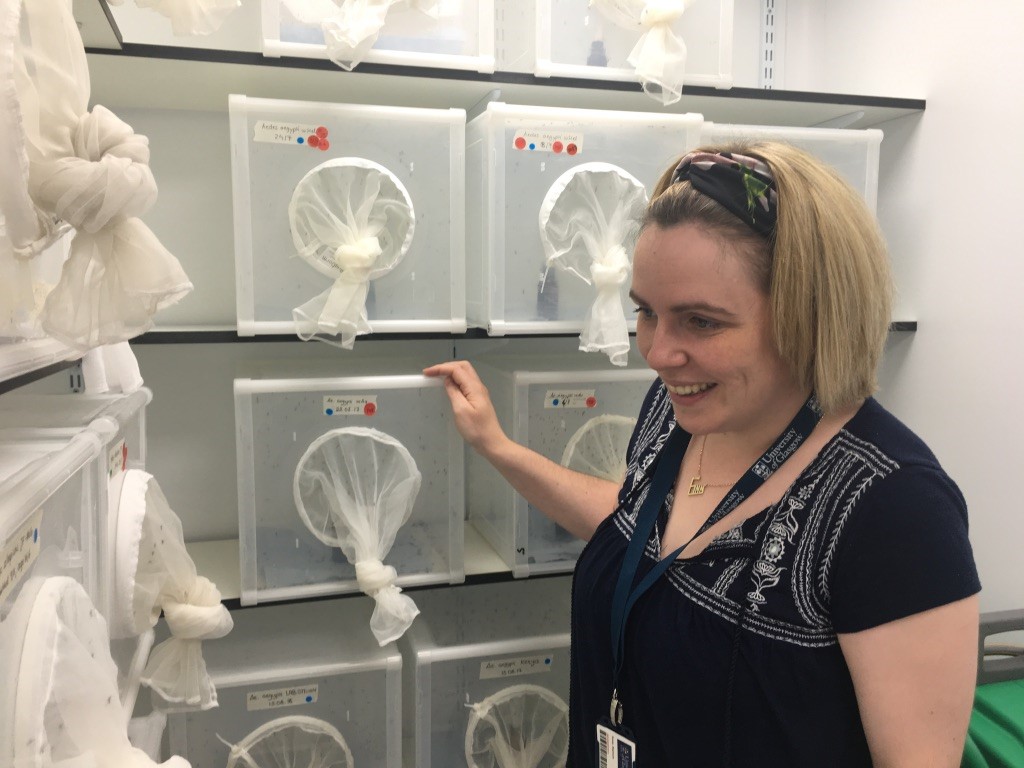
Dr. Terrance Kummer (right) with Dr. Andrew Sauerbeck, first author of the article
Dr. Terrance Kummer and his team at the Hope Center for Neurological Disorders at Washington University in St. Louis (USA) have published an article describing a new method for quantifying brain synapses using ZEISS Airyscan technology. This method is simpler to implement and could enable more researchers to apply these types of analyses to critical questions in health and disease of the nervous system.
Dr. Kummer answered some questions for us about his research and this new method.
What are your research goals?
The overall goals of the Kummer lab are to understand how traumatic brain injury (TBI) damages the brain in the short term, and how these processes lead to long-term degeneration and cognitive decline.
TBI is the leading cause of death and disability for younger people, and also the best-established environmental risk factor for Alzheimer’s disease and related dementias. The connections between early brain trauma and later neurodegeneration, however, are not clear. We believe that fundamental processes likely underlie immediate disability after TBI and precipitate the development of dementia down the road. We hope to identify these processes, target them with specific therapies, and ultimately improve outcomes for the victims of TBI that I care for in the hospital.
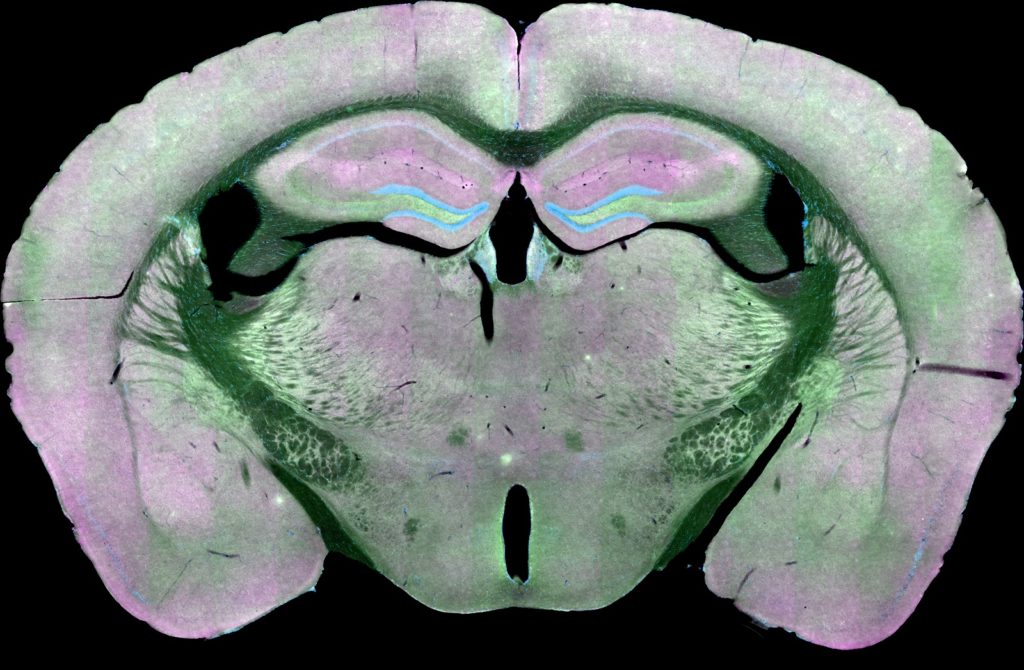
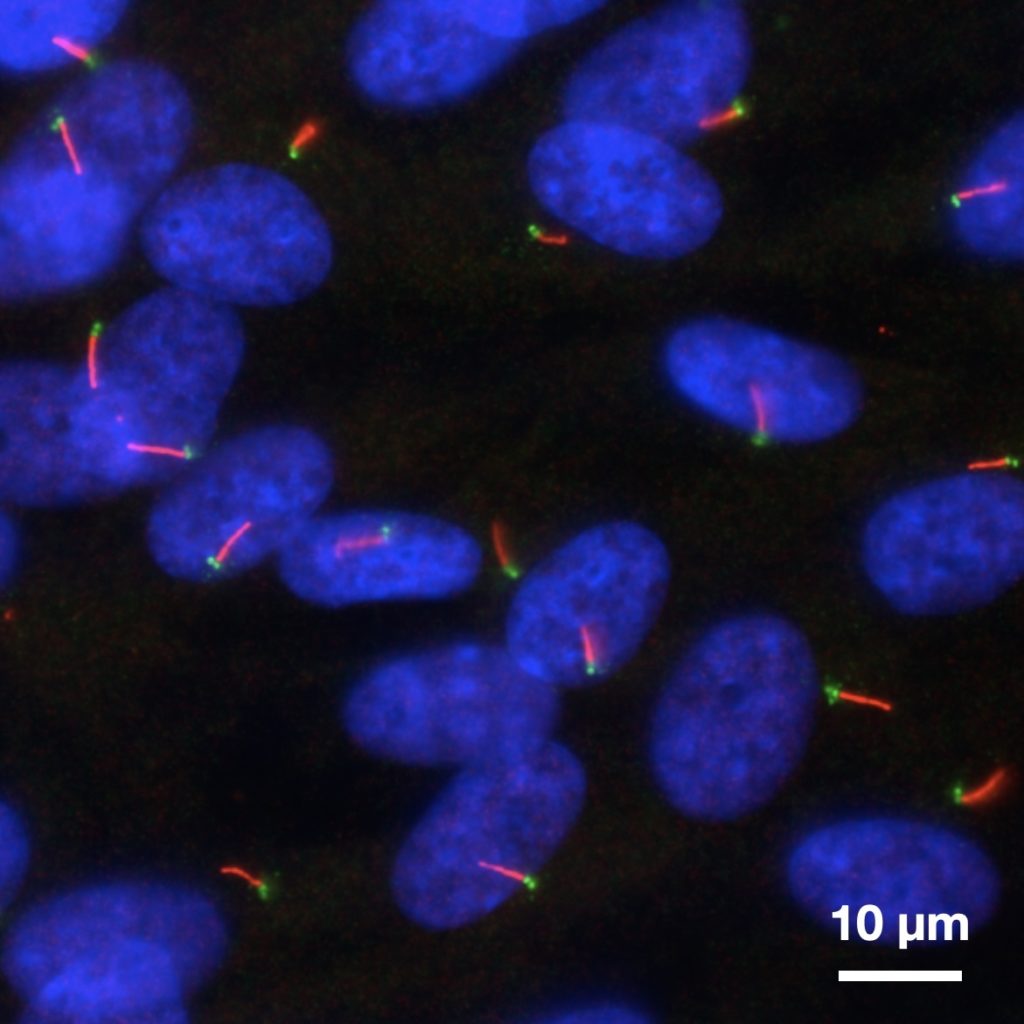
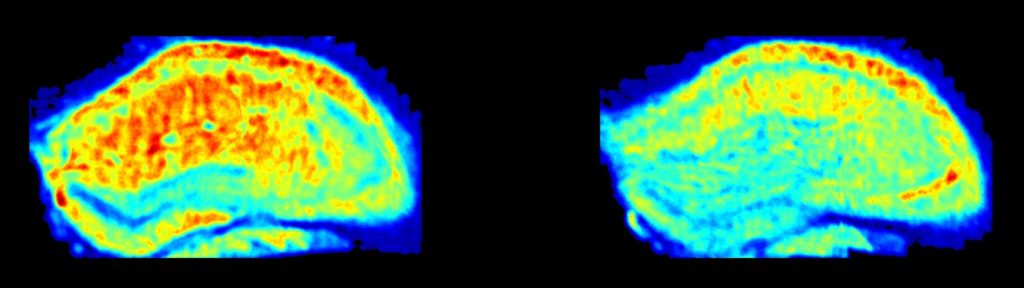
Low-magnification image of brain mouse brain section labeled against the presynaptic marker synapsin (green) and the postsynaptic marker PSD-95 (magenta). Nuclei are blue. Image acquired with ZEISS Axio Scan.Z1 slide scanner.
Why quantify brain synapses in order to study traumatic brain injury?
The highlighted publication reports on a method we devised to better characterize one possible source of short and long-term disability after TBI—synapse loss.
We were motivated to investigate synaptic injury after TBI because synapse loss is an early and prevalent finding in Alzheimer’s disease and many other dementing conditions. Synapse loss, moreover, is a better predictor of cognitive decline in Alzheimer’s disease than any other pathological feature, including plaques and tangles. We wondered whether TBI might induce synapse loss, thereby preventing neurons from communicating and increasing the risk of later dementia.
Tell us a little bit about your new method for analyzing brain synapses
Characterizing the structure and molecular features of synapses in the brain is challenging. Synapses are both below the resolution of traditional light microscopic techniques and packed at extreme densities in an extraordinarily complex milieu of cellular structures.
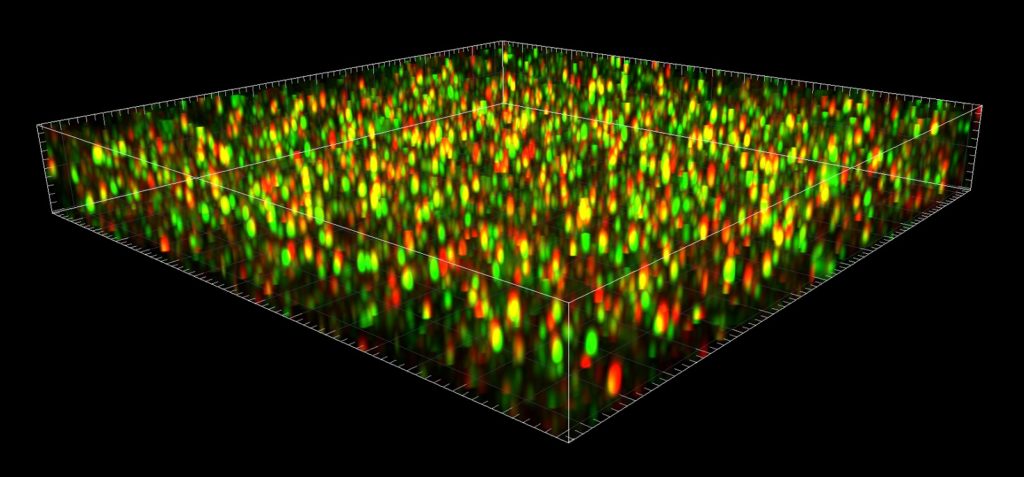
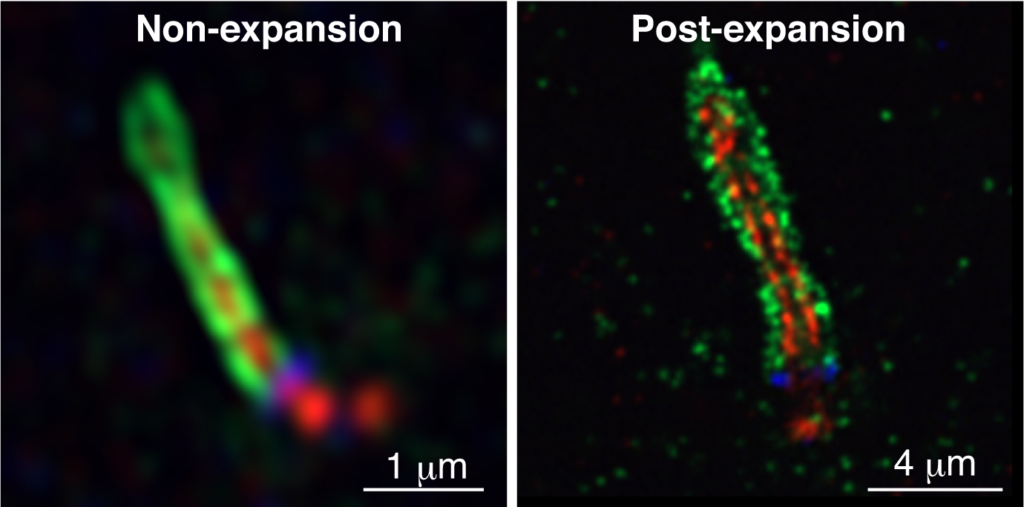
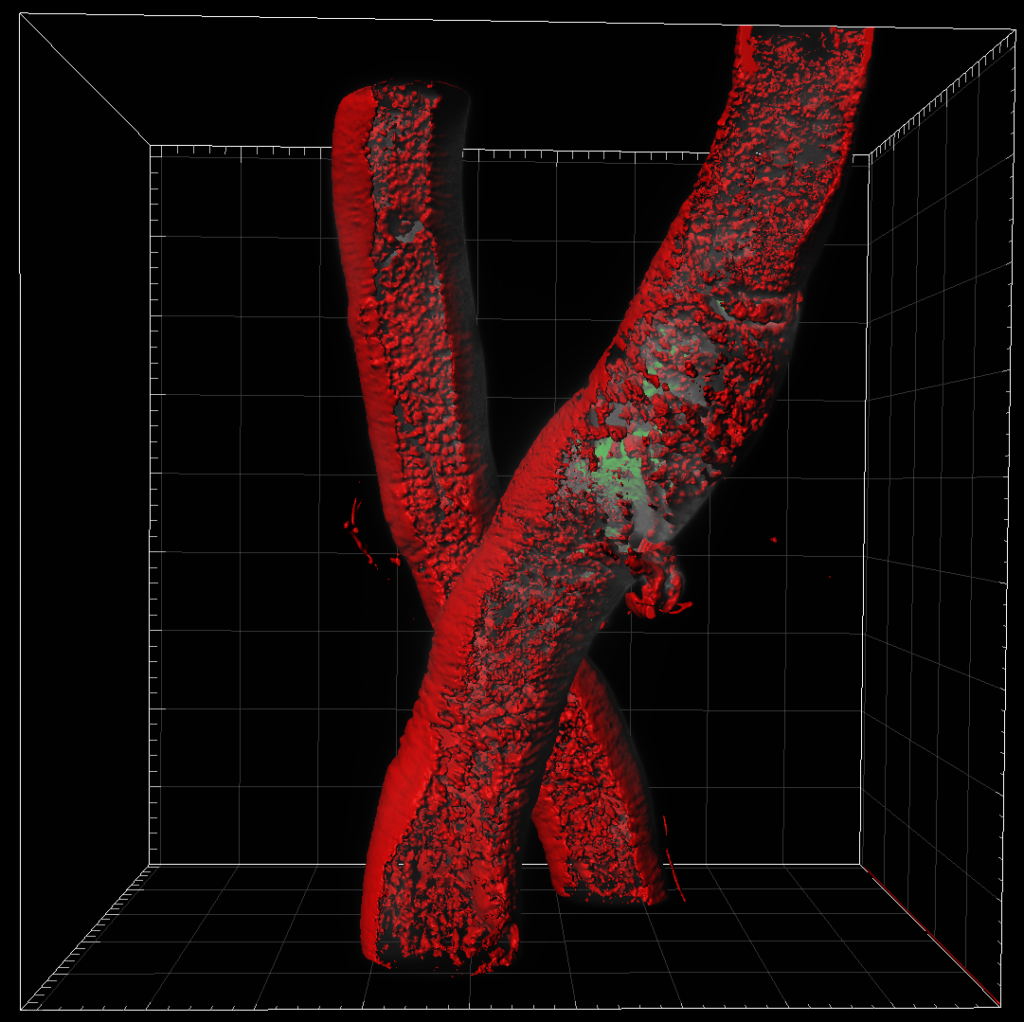
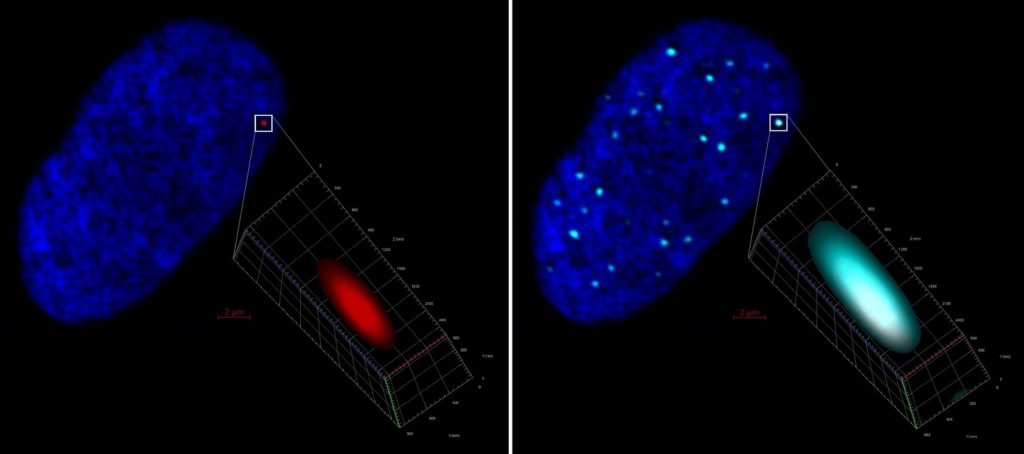
Pre- (green) and postsynaptic markers (red) are imaged with superresolution using ZEISS Airyscan.
Several approaches have been devised to overcome this problem, such as electron microscopy, array tomography, and optical super resolution, but all have significant drawbacks that limit their use.
We sought to develop a more accessible and straightforward method to identify, characterize, and quantify synapses that would help the approaches catch up to the field. That is, we wanted a technique that researchers could employ to answer questions involving many samples, many conditions, across age, and across space (cover large regions of the brain). All of these are necessary to understand brain injury and its link to long-term outcomes.
Why is it called “SEQUIN”?
We chose the name “SEQUIN” for the technique because it was both a good distillation of the key features of the analysis method–Synaptic Evaluation, QUantitation, and the images it produces reminded us of sequins glinting from a dark field. There was an active debate in the lab about what to call it! I prevailed, and everyone else pretended to be happy about it.
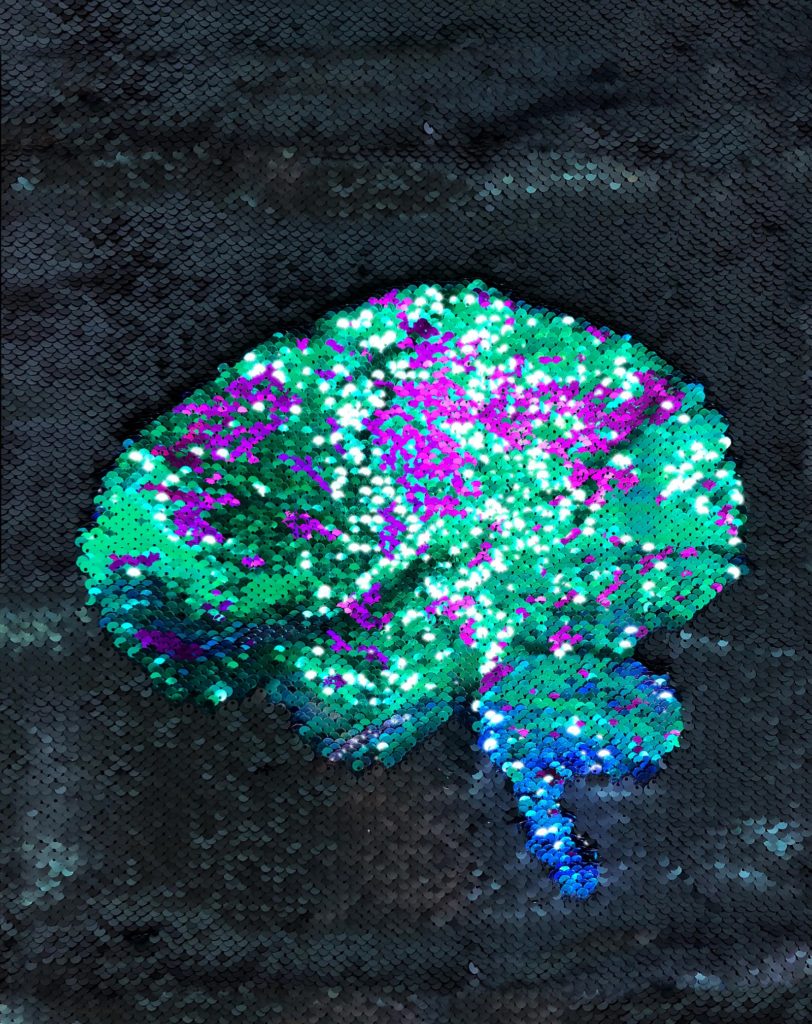
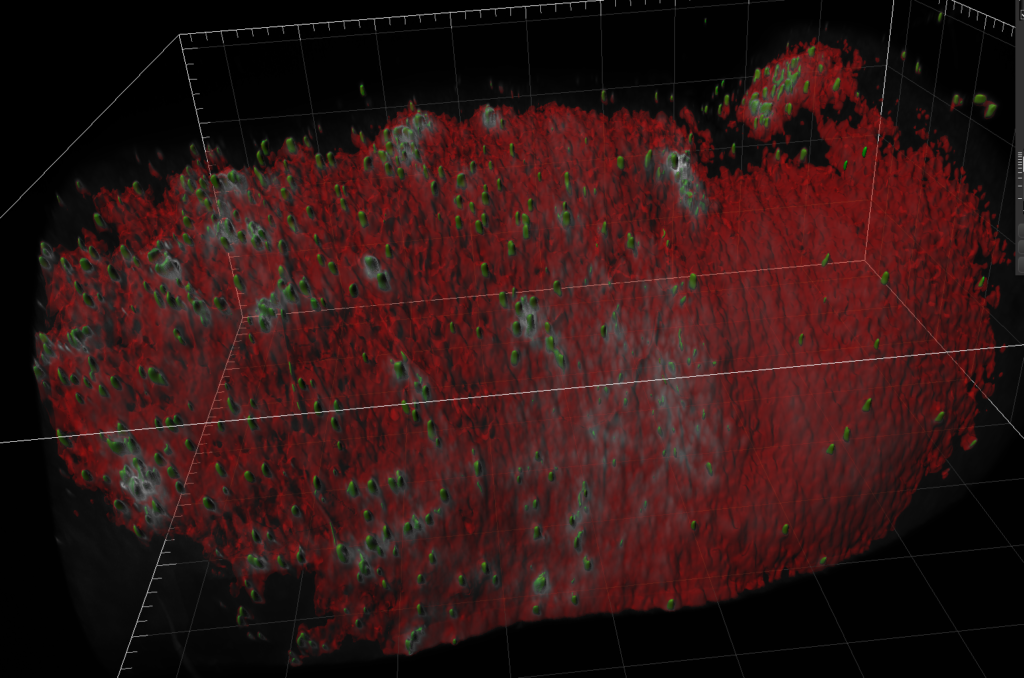
SEQUIN multiscale imaging seeks to understand brain structure and function by revealing the patterns of its synaptic connections, here represented by sequins, perhaps one day over the entire brain. Artwork credit: Story Kummer
Where do you think this new method will bring an impact in research?
We believe that SEQUIN will open the door for non-specialist researchers to add synaptic structural and molecular analysis to their research questions. Said another way, we hope that labs that don’t focus full-time on synaptic analysis will now nonetheless have a low burden pathway to rigorously investigate synaptic endpoints in their studies. We believe that synaptic alterations, both adaptive and pathological, are an extremely common feature of the brain’s response to stimuli, whether those are developmental, experience-dependent, or the result of a brain injury or disease. We expect SEQUIN will enable a better understanding of these important processes.
Learn More
Read the full publication SEQUIN Multiscale Imaging of Mammalian Central Synapses Reveals Loss of Synaptic Connectivity Resulting from Diffuse Traumatic Brain Injury
Visit Dr. Kummer’s lab webpage or follow him on Twitter.
Get more information on ZEISS Airyscan, available on most ZEISS laser scanning confocal microscopes.
Read Next
The post A Better Method for Counting Brain Synapses appeared first on Microscopy.